![]()
Use the MiniProfiler
Once the application pool has reset, the MiniProfiler is displayed in the bottom corner of the screen.

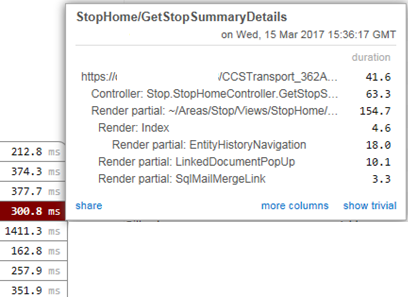
Click an entry to view a breakdown of task times for that job.

The detail dialog displays the following options:
- share – exports the contents of the dialog to a webpage, the address of which can be shared with other parties (such as Transport Application Support) if needed.
- more columns – displays a more detailed summary of the server’s response times.
- show trivial – displays those tasks that took 2ms or less to complete. Ordinarily, these tasks are not displayed in the summary.